

Market size estimation for a new invention is the process of quantifying the revenue opportunity by defining your target market and applying realistic assumptions supported by multiple data sources. Inventors and entrepreneurs who skip this step often build products nobody buys or pitch investors without credible numbers. The three core frameworks you need are TAM (Total Addressable Market), SAM (Serviceable Addressable Market), and SOM (Serviceable Obtainable Market). Federal sources like the U.S. Census Bureau, the Bureau of Labor Statistics, and platforms like Inventifystudios give you the data and tools to build estimates that hold up under scrutiny.
What are TAM, SAM, and SOM for new inventions?
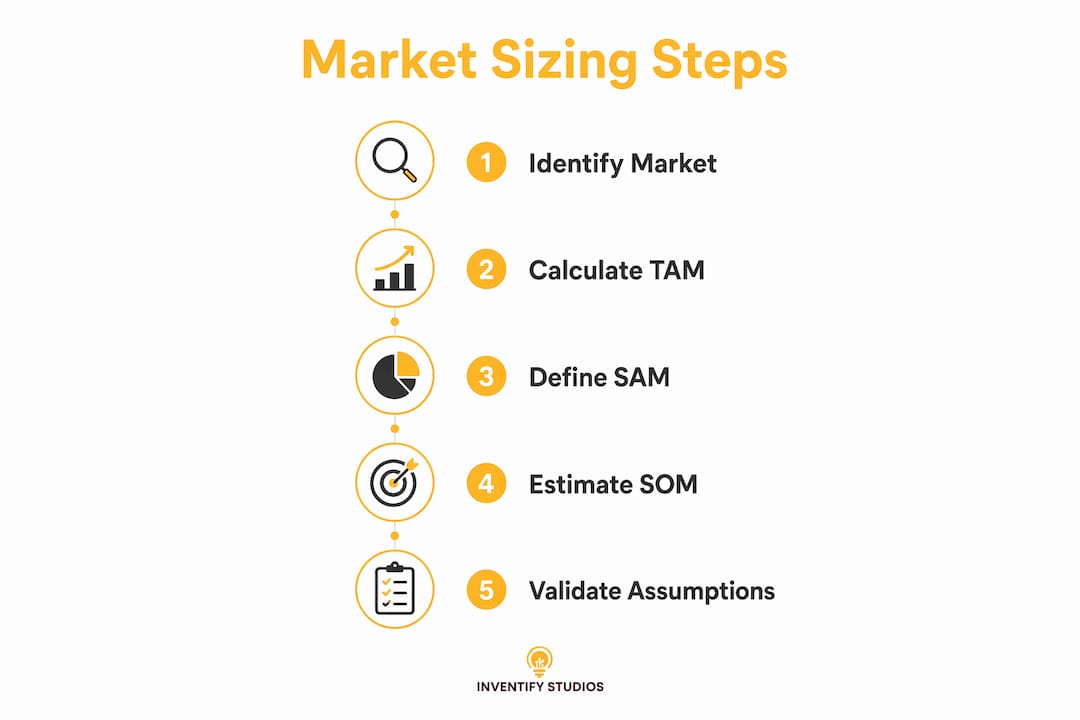
TAM, SAM, and SOM are nested market tiers that define the full revenue opportunity, the realistic slice you can serve, and the near-term revenue you can actually win. Every credible market size estimate for a new invention starts here. Skipping any tier produces numbers that investors immediately distrust.
TAM (Total Addressable Market) is the total revenue your invention could generate if every potential buyer in the world purchased it. This number is theoretical. It sets the ceiling and shows the scale of the opportunity, but no early-stage product ever captures it.
SAM (Serviceable Addressable Market) narrows TAM down to the customers you can realistically reach given your geography, pricing, and distribution channels. If your invention targets U.S. small businesses in the food service industry, your SAM excludes global enterprises and unrelated sectors.

SOM (Serviceable Obtainable Market) is the portion of SAM you can realistically win in the near term. Calculating SOM realistically means capping your near-term target at roughly 5% of SAM for new market entrants. That calibrated approach produces revenue models investors actually believe.
Here is why each tier matters for your invention:
- TAM proves the market is large enough to justify building the product.
- SAM shows you understand your real customer base and go-to-market constraints.
- SOM demonstrates you have a grounded plan for early revenue and growth.
Early-stage products in fragmented markets typically capture 1–2% of SAM as an effective SOM. That figure sounds small, but a 1% capture of a $500 million SAM is a $5 million revenue target. That is a fundable business.
Pro Tip: Never present TAM as your business target. Investors know you will not capture 100% of any market. Show SOM as your 12-to-24-month revenue goal and explain exactly how you will reach it.
How to estimate market size for a new invention without existing data
Most new inventions lack a ready-made market category. That means you cannot simply pull a report and cite a number. You build your estimate by triangulating three independent methods.
The bottom-up formula
Bottom-up market sizing uses unit economics as its foundation: Number of potential customers × Average selling price = Revenue opportunity. This approach is grounded in real buyers and real prices, which is why investors favor it over top-down methods. Top-down approaches inflate potential and are regularly flagged as unreliable.
The three triangulation methods
-
Size-down (top-down). Start with a large industry figure from a published report or federal database. Filter it by geography, customer segment, and product fit until you reach a realistic SAM. This gives you an upper bound.
-
Size-up (bottom-up). Count your potential customers using Census Bureau data or keyword search volumes. Multiply by your price point. This gives you a grounded lower bound.
-
Proxy market analysis. When your invention creates a new category, proxy market analysis of adjacent markets estimates willingness to pay by disruption analogy. If your invention replaces an existing inefficient solution, the spending on that solution is your proxy market size.
Running all three methods produces a range, not a single number. A triangulated TAM range might span $100 million to $300 million for a typical invention. That range is more credible than a single "magic number" because it shows you tested your assumptions from multiple angles.
Document every assumption
Write down every input you used: the data source, the date, the filter criteria, and the logic. Investors will ask. Vague or broad market definitions produce less reliable numbers and can derail planning. Describing your exact target customer with demographics, geography, and a specific problem before you calculate yields far more credible results.
Pro Tip: Present your market size as a range with a low, mid, and high scenario. Label each scenario's key assumption. This signals analytical rigor and gives investors a framework to stress-test your model.
What data sources work best for invention market sizing?
Reliable data inputs are the difference between a defensible estimate and a guess. Federal databases are the most credible starting point for U.S.-based inventions.
The most useful federal sources include:
- Census Bureau County Business Patterns (CBP): Provides establishment counts and payroll data by NAICS code and geography. Use this to count potential business customers in your target segment.
- Statistics of U.S. Businesses (SUSB): Breaks down firms by size, industry, and location. Ideal for filtering SAM by company size.
- Bureau of Labor Statistics Quarterly Census of Employment and Wages (QCEW): Delivers wage and employment data by industry. Useful for sizing labor-intensive markets.
Federal data sources filtered by NAICS codes link abstract market size figures to concrete potential customers or firms. That connection dramatically improves investor confidence and planning accuracy.
Beyond federal databases, keyword research tools give you real-time demand signals. Monthly search volumes for problem-related queries show how many people actively seek a solution your invention provides. Industry reports from trade associations add qualitative context. Combining quantitative data with direct customer feedback produces the most complete picture of market demand.
How do you validate your market size assumptions?
Calculating a number is not the same as proving it. Validation closes the gap between your model and reality.
-
Run discovery interviews. Conduct 8–15 customer interviews focused entirely on understanding workflows and pain points, not pitching your invention. These interviews typically run 20–45 minutes. They reveal whether the problem you are solving is urgent enough to drive purchasing behavior.
-
Analyze the competitive landscape. The Small Business Administration recommends that inventors assess market saturation and barriers to entry alongside market size. Ignoring competition leads directly to overestimating obtainable market share.
-
Run digital validation tests. Build a simple landing page describing your invention's core benefit. Drive traffic with a small paid ad budget. Landing page conversion rates and ad response data pressure-test your market assumptions before you invest heavily in product development. Low conversion rates signal a need to adjust your positioning or business model.
-
Adjust your MVP scope to match SOM. Your Minimum Viable Product should target the narrowest, most winnable segment of your SOM. Winning that segment first builds the proof of traction that unlocks the next layer of your SAM.
-
Pressure-test every assumption. Go back to your model after each validation step and update the inputs. A living model that reflects real data is far more useful than a static spreadsheet built before you talked to a single customer.
The invention validation steps that separate funded inventors from unfunded ones almost always include this cycle of estimate, test, and revise. Skipping validation is the most common reason market size models fall apart in due diligence.
Pro Tip: Ask interviewees what they currently spend to solve the problem your invention addresses. That number is your real willingness-to-pay data point, and it anchors your pricing assumptions directly to customer behavior.
Key Takeaways
Credible market size estimation for a new invention requires TAM, SAM, and SOM frameworks combined with triangulated data sources and real customer validation to produce investor-ready results.
| Point | Details |
|---|---|
| Use TAM, SAM, and SOM | Define all three tiers to show investors you understand the full opportunity and your realistic near-term target. |
| Build bottom-up first | Multiply potential customers by your price point to anchor your estimate in real unit economics. |
| Triangulate with three methods | Combine size-down, size-up, and proxy analysis to produce a credible range instead of a single number. |
| Validate with real customers | Run 8–15 discovery interviews and digital tests to confirm demand before scaling investment. |
| Document every assumption | Record your data sources, filters, and logic so your model holds up under investor scrutiny. |
Why most inventors get market sizing wrong
Most inventors I have worked with make the same mistake: they lead with a massive TAM figure and call it their market. A $50 billion industry number looks impressive on a slide. It tells an investor almost nothing about whether this specific invention can win customers.
The real credibility signal is a well-constructed SOM. When an inventor says "We are targeting 5,000 food service businesses in the Southeast, at $1,200 per year, which gives us a $6 million SOM in year one," that is a fundable story. It shows discipline. It shows the inventor understands their go-to-market constraints.
The other mistake I see constantly is skipping the proxy method for truly novel inventions. If your invention has no direct market category, the spending on the inefficient solution it replaces is your most honest market signal. Inventors who ignore adjacent markets tend to either wildly overestimate demand or underestimate it entirely.
The low-cost validation methods that work best are the ones that generate real behavioral data, not opinions. A landing page that converts at 3% tells you more than 50 people saying "that sounds interesting" in a survey.
My honest advice: build your bottom-up model first, run your triangulation, then go talk to 10 real potential customers before you finalize any number. The model will change. That is the point.
— Hua
Inventifystudios: your next step in market potential assessment
Knowing your TAM, SAM, and SOM is only the beginning. Turning those numbers into a fundable invention concept requires the right tools at every stage.

Inventifystudios gives inventors an AI-powered platform to run invention marketability analysis, generate 3D prototypes, and assess patentability without the cost of traditional consulting. You can validate your market assumptions, build patent-ready drafts, and stress-test your concept all in one place. Whether you are sizing your first market or refining an existing model, Inventifystudios removes the barriers that slow most inventors down. The platform is built for creators who want clarity fast, without paying consulting fees that eat into their runway.
FAQ
What is market size estimation for a new invention?
Market size estimation for a new invention is the process of quantifying the total revenue opportunity by defining TAM, SAM, and SOM using multiple data sources and realistic assumptions. It is the foundation of any credible business plan or investor pitch.
What is the difference between TAM, SAM, and SOM?
TAM is the total theoretical market, SAM is the realistic subset you can serve given your constraints, and SOM is the near-term revenue you can actually capture. New market entrants typically target roughly 5% of SAM as their SOM.
How do I estimate market size when no data exists for my invention?
Use the bottom-up formula (potential customers × average price), then triangulate with size-down, size-up, and proxy methods using adjacent market data. Present a range with documented assumptions rather than a single number.
What federal data sources help with invention market sizing?
The Census Bureau County Business Patterns, Statistics of U.S. Businesses, and BLS Quarterly Census of Employment and Wages all provide establishment counts, payroll, and wage data by NAICS code. These sources make abstract market figures concrete and defensible.
How many customer interviews do I need to validate my market assumptions?
Conducting 8–15 discovery interviews focused on customer pain points and current spending gives you enough qualitative data to pressure-test your model. Pair interviews with digital validation tests like landing pages for behavioral confirmation.