

Consumer behavior analysis is the systematic study of how and why people select, buy, use, and dispose of products or services, combining quantitative signals and qualitative motivations to guide business decisions. Done well, it directly supports segmentation, personalization, churn prediction, and product-market fit. Done poorly, it produces dashboards nobody acts on.
Here is what this guide covers:
- The core signals and psychological drivers analysts track
- Data collection methods and the first-, second-, third-party distinction
- A step-by-step workflow from objective-setting to monitoring
- Segmentation techniques and persona construction
- Customer journey mapping and touchpoint prioritization
- Predictive analytics methods and when to use each
- Tool selection criteria, including GA4, Mixpanel, Qualtrics, and NielsenIQ
- 2026 research trends and what they mean for your pipeline
Key Takeaways
Consumer behavior analysis produces its highest value when a clear objective drives signal selection, not the other way around.
| Point | Details |
|---|---|
| Define one objective first | Acquisition, retention, and product-market fit each require different signals and methods. |
| Instrument before you buy tools | A clean event taxonomy in GA4 outperforms an enterprise platform with fragmented tracking. |
| Reviews are now a core signal | A 2026 study found 46.3% of consumers cite reviews as their primary purchase factor. |
| Combine quantitative and qualitative | Behavioral events show what happened; surveys and interviews explain why. |
| AI agents require new signal types | Accenture's 2026 Consumer Pulse finds delegation to AI agents alters basket size and brand selection. |
Table of Contents
- What is consumer behavior analysis, and what does it actually measure?
- Why consumer behavior analysis matters for business outcomes
- What data should you gather, and how do you collect it?
- How do you perform a consumer behavior analysis step by step?
- How do segmentation and persona building work together?
- How do you map customer journeys and prioritize touchpoints?
- What analytic methods and predictive techniques should you use?
- Which tools support consumer behavior analysis at scale?
- What pitfalls and ethical risks should you watch for?
- What 2026 trends are reshaping consumer behavior analysis?
- What should you build first? A practitioner perspective
- Sources
What is consumer behavior analysis, and what does it actually measure?
Consumer behavior analysis draws on behavioral economics adapted to marketing contexts, which means standard lab models need adjustment. Marketing introduces status consumption, advertising effects, and interpersonal influence that pure behavioral economics does not account for. The practical model most teams use is the buyer's black box: marketing stimuli enter, internal psychological and environmental variables filter them, and a purchase response comes out. Identical campaigns produce different outcomes across segments because the black box differs for each group.
What analysts actually measure falls into five signal categories:
- Transactional data: purchase history, average order value (AOV), cart abandonment rate, return rate
- Behavioral events: page views, clicks, session depth, feature usage, search queries
- Engagement metrics: click-through rate (CTR), email open rate, Net Promoter Score (NPS)
- Qualitative feedback: reviews, support tickets, interview transcripts, social sentiment
- Third-party panel data: category-level purchase behavior, household penetration, share of wallet
Psychological and social drivers sit behind every signal. Motivation, social proof, scarcity, and status shape why a consumer acts, not just whether they act. Both signals are necessary.
Signal prioritization depends on your objective. Acquisition work leans on CTR, conversion rate, and attribution data. Retention work centers on CLTV, churn rate, and NPS. Product-market fit analysis needs qualitative feedback and feature-adoption cohorts. Choosing the wrong signals for the objective is one of the most common and costly mistakes in a consumer behavior study.
Why consumer behavior analysis matters for business outcomes
Understanding consumer behavior is not an academic exercise. It translates directly into revenue and cost metrics.
- Personalization: Behavioral segments let you serve relevant offers, reducing wasted impressions and lifting conversion rates.
- Churn reduction: Early behavioral signals (declining login frequency, shrinking basket size) allow intervention before a customer cancels, improving the CAC-to-LTV ratio.
- Demand forecasting: Purchase-pattern analysis feeds more accurate inventory and production models.
- Product decisions: Feature-adoption data and qualitative feedback identify what to build next and what to cut.
- Marketing efficiency: Attribution modeling and cohort analysis reveal which channels produce high-CLTV customers, not just high-volume clicks.
NielsenIQ's consumer behavior research guidance makes the case plainly: businesses that move beyond basic demographics to psychographic and behavioral segmentation are better positioned to survive rapid market shifts. Demographics tell you who bought; behavior tells you why, and why they might not next time.
A concrete example: a subscription software company segments its user base by feature-adoption cohorts 30 days after signup. Users who activate three or more core features in the first week show a 60-day retention rate roughly double that of users who activate only one. The company redirects onboarding resources toward that activation threshold. Churn drops. No new product required.
What data should you gather, and how do you collect it?
First-, second-, and third-party data
First-party data comes directly from your customers: CRM records, POS transactions, product telemetry, support tickets, and survey responses. It is the most accurate and privacy-safe source you have. Use it as your foundation.
Second-party data is another company's first-party data shared through a direct partnership. A retailer sharing purchase data with a CPG brand is a common example. It extends your view without the noise of open-market data.
Third-party data comes from panels, data brokers, and market research firms. It provides category-level context and competitive benchmarking that your own data cannot supply. Its accuracy has declined as cookie deprecation accelerates, so treat it as directional rather than definitive.
Concrete sources to instrument and connect:
- CRM and POS systems for transactional history
- GA4 event streams for web and app behavioral data
- Product telemetry for feature-level usage
- Support tickets and review platforms for qualitative signals
- Social listening tools for sentiment and trend detection
- NielsenIQ or similar panels for category benchmarking
Collection methods
Instrumentation is the foundation. Define an event taxonomy before you write a single tracking call. Consistent naming conventions (noun_verb: product_viewed, cart_added) prevent the data fragmentation that makes downstream analysis unreliable.
Surveys capture stated preferences and motivations that behavioral data cannot infer. Keep them short: three to five questions at a high-friction moment (post-cancellation, post-purchase) yield better response rates than long periodic surveys.
Observational research and usability sessions surface friction points that quantitative funnels only hint at. Watching five users attempt a checkout flow often explains a conversion drop faster than a month of A/B testing.
Panel data from providers like NielsenIQ fills the competitive blind spot: you can see your own funnel clearly, but you cannot see where your customers go when they leave.
Privacy and compliance note: U.S. marketers operate under a patchwork of state laws, including the California Consumer Privacy Act (CCPA) and its amendment, the CPRA. Data minimization, clear consent flows, and de-identification of behavioral records are not optional best practices; they are legal requirements in covered states. Build consent infrastructure before you scale data collection, not after.
Pro Tip: Combine first-party behavioral events with a short post-purchase survey to capture the "why" behind the "what." Even a single open-text question ("What almost stopped you from buying?") produces qualitative signal that no clickstream can replicate. For affordable qualitative feedback methods that scale on a lean budget, the principle is the same: small-sample interviews often outperform large-scale surveys on insight quality.
A 2026 study published in Frontiers in Communication found that 46.3% of consumers cite reviews and ratings as their primary purchase factor, while 74.6% reported purchasing via social media ads but with lower repeat purchase rates. That gap between acquisition and retention is exactly where behavioral data collection earns its budget.
How do you perform a consumer behavior analysis step by step?
- Define your objective. Acquisition, retention, product-market fit, or pricing optimization each require different signals and methods. One objective per analysis cycle prevents scope creep.
- Identify signals and data sources. Map the metrics that directly measure your objective. For churn prediction: login frequency, feature adoption, support ticket volume, and NPS trend.
- Instrument and collect. Implement your event taxonomy, QA the tracking, and establish a data pipeline to your warehouse or analytics platform. Document naming conventions in a shared schema.
- Clean and join data. Resolve identity across devices and sessions. Deduplicate records. Handle missing values explicitly rather than silently dropping rows.
- Segment. Apply RFM, cohort, or behavioral clustering to divide your population into groups with meaningfully different patterns.
- Model or experiment. Run a funnel analysis, build a propensity model, or design an A/B test. Match the method to the data volume and the decision speed you need.
- Implement actions. Translate findings into specific changes: a new onboarding email sequence, a pricing page redesign, a targeted retention offer for high-risk segments.
- Monitor and optimize. Set dashboards and alerts for the KPIs your action was meant to move. Schedule a model-retraining cadence (quarterly for most propensity models). Review holdout groups to confirm causation.
Short example: An e-commerce team wants to reduce cart abandonment. They define the objective (step 1), identify cart-add and checkout-initiation events plus exit-intent survey responses (step 2), confirm GA4 event tracking fires correctly (step 3), join session data with CRM records (step 4), segment abandoners by device type and traffic source (step 5), run an A/B test on a simplified checkout flow for mobile users (step 6), ship the winning variant (step 7), and monitor weekly checkout conversion rate with an alert if it drops below baseline (step 8).
Monitoring checklist:
- Weekly KPI dashboard reviewed by the owning team
- Automated alert on metric deviation beyond a defined threshold
- Monthly holdout-group review to confirm causal lift
- Quarterly model audit for drift in propensity or CLTV scores
- Annual data governance review covering consent records and retention policies
For a deeper look at how AI supports each stage of this workflow, the same principles of signal collection and iterative validation apply across product categories.
How do segmentation and persona building work together?
Raw behavioral data becomes useful when it groups customers with similar patterns and motivations. The most common segmentation approaches:
- RFM (Recency, Frequency, Monetary): Ranks customers by how recently they bought, how often, and how much. Fast to compute, easy to act on for retention and win-back campaigns.
- Cohort segmentation: Groups users by a shared start event (signup date, first purchase month) to track how behavior evolves over time. Reveals whether product changes actually improved retention.
- Psychographic segmentation: Groups by values, attitudes, and lifestyle. Requires survey or qualitative data to construct but produces segments with distinct messaging needs.
- Lifecycle stage: New, active, at-risk, lapsed, and churned customers each need different interventions.
- Intent signals: Search queries, content consumption patterns, and feature-exploration sequences indicate where a customer is in their decision process.
NielsenIQ recommends moving beyond demographics to psychographic and behavioral segmentation precisely because demographic groups are too broad to predict purchase behavior reliably.
Quantitative clusters identify who behaves similarly. Qualitative validation explains why. Run five to eight interviews per cluster before writing personas. The interviews will surface motivations, vocabulary, and objections that no clickstream reveals.
A lightweight persona template
| Field | What to populate |
|---|---|
| Segment name | Short label tied to behavior (e.g., "High-frequency mobile buyer") |
| Behavioral triggers | Events that precede purchase or churn |
| Primary motivation | Stated goal from interviews or survey open-text |
| Key objections | Top reasons for abandonment or non-conversion |
| Preferred channel | Where they engage most (email, push, in-app) |
| CLTV band | Revenue tier this segment represents |
Prioritize segments for experiments by combining CLTV band with behavioral trigger frequency. A high-CLTV segment with a clear, measurable trigger is your first test candidate. For marketability analysis approaches that map directly to persona construction, the same framework applies: identify who values the product most, then validate with direct feedback.
How do you map customer journeys and prioritize touchpoints?
Journey mapping converts segmented behavioral data into a visual sequence of stages, touchpoints, and friction points. The process:
- Identify personas. Use the segments from the previous step. One journey map per primary persona.
- Map stages. Awareness, consideration, purchase, onboarding, retention, advocacy. Label each stage with the customer's goal, not your business goal.
- List touchpoints and signals. For each stage, list every channel interaction (ad impression, landing page, email, support chat) and the behavioral signal that confirms the customer moved through it.
- Assign KPIs and ownership. Each touchpoint needs a metric (conversion rate, time-to-next-action, NPS) and a team owner. Unowned touchpoints do not get fixed.
- Prioritize by impact vs. effort. A 2x2 quadrant with impact on one axis and implementation effort on the other surfaces quick wins (high impact, low effort) and flags expensive bets (high effort, uncertain impact).
Quick wins typically live at high-traffic, high-friction points: the checkout page, the onboarding email sequence, and the first-use experience. These touchpoints affect the largest number of users and have well-established testing patterns.
Pro Tip: Map the journey from the customer's perspective first, then overlay your data. Teams that start with their own funnel metrics tend to miss the stages that happen before the customer ever reaches their owned channels, particularly the review-reading and social-comparison stages that now drive nearly half of purchase decisions.
Once the map is complete, convert findings into a test backlog. Each friction point becomes a hypothesis: "Simplifying the address form on mobile will increase checkout completion for the mobile-first segment." Each hypothesis gets a metric, a minimum detectable effect, and a sample-size estimate before it enters the queue.
What analytic methods and predictive techniques should you use?
The right method depends on your data volume, decision speed, and interpretability requirements.
- Funnel analysis: Measures drop-off between sequential steps. Best for diagnosing conversion problems. Requires event-level data.
- Cohort analysis: Tracks a group's behavior over time from a shared start event. Best for measuring retention and product-change impact.
- RFM scoring: Ranks customers for targeting. Low data requirements, fast to implement, limited predictive power.
- CLTV modeling: Predicts the revenue a customer will generate over their lifetime. Requires transaction history and a churn probability estimate.
- Propensity scoring: Assigns a probability of a future action (purchase, churn, upgrade) to each customer. Requires labeled historical data and a modeling environment.
- Survival analysis: Models time-to-event (time to churn, time to second purchase). Handles censored data well; useful for subscription businesses.
- Attribution modeling: Allocates conversion credit across touchpoints. Data-driven attribution (available in GA4) outperforms last-click for multi-touch journeys.
- A/B and multivariate experiments: The only method that establishes causation. Required before scaling any behavioral intervention.
Interdisciplinary research frames consumer behavior analysis as uniting behavioral economics, behavior analysis, and marketing science, which is why no single method covers every question. Practitioners who rely only on funnel analysis miss the retention dynamics that cohort analysis reveals; those who rely only on propensity models miss the causal validation that experiments provide.
| Method | Best for | Key data inputs | Latency |
|---|---|---|---|
| Funnel analysis | Conversion diagnosis | Event streams | Real-time |
| Cohort analysis | Retention measurement | Event streams + timestamps | Batch (daily/weekly) |
| RFM scoring | Targeting and win-back | Transaction history | Batch |
| CLTV modeling | Segment prioritization | Transactions + churn labels | Batch |
| Propensity scoring | Personalization triggers | Behavioral events + labels | Near real-time or batch |
| A/B experiment | Causal validation | Any metric with a control group | Real-time |
Which tools support consumer behavior analysis at scale?
Tool selection comes down to four questions: What data do you own? How fast do you need insight? Who on your team will use it? And what does integration actually cost?
Google Analytics 4 (GA4) is the default starting point for web and app behavioral data. Its event-based model replaces the session-based structure of Universal Analytics, making it better suited for cross-platform journeys. GA4 connects natively to BigQuery for warehouse-scale analysis and supports data-driven attribution. Best for teams that need free, scalable web behavioral data with strong Google ecosystem integration.
Mixpanel is a product analytics platform built for event-level user behavior. Its funnel, retention, and flow reports are faster to configure than GA4's equivalents, and its user-level querying makes cohort analysis accessible without SQL. Best for product and growth teams who need to answer behavioral questions quickly without a dedicated data engineer.
Qualtrics covers the qualitative and experience side: surveys, NPS programs, conjoint analysis, and customer journey feedback. Its XM (Experience Management) platform connects survey responses to operational data, which is the link most analytics stacks miss. Best for CX teams and researchers who need to pair stated preferences with behavioral signals.
NielsenIQ provides panel-based market measurement: category-level purchase data, household penetration, and competitive share of wallet. It fills the competitive blind spot that first-party data cannot address. Best for CPG, retail, and brand teams that need to benchmark their performance against category dynamics.
Beyond these four, experimentation platforms (Optimizely, VWO) and Customer Data Platforms (Segment, mParticle) round out a mature analytics stack. CDPs are particularly valuable for resolving identity across channels and feeding consistent behavioral data to downstream tools.
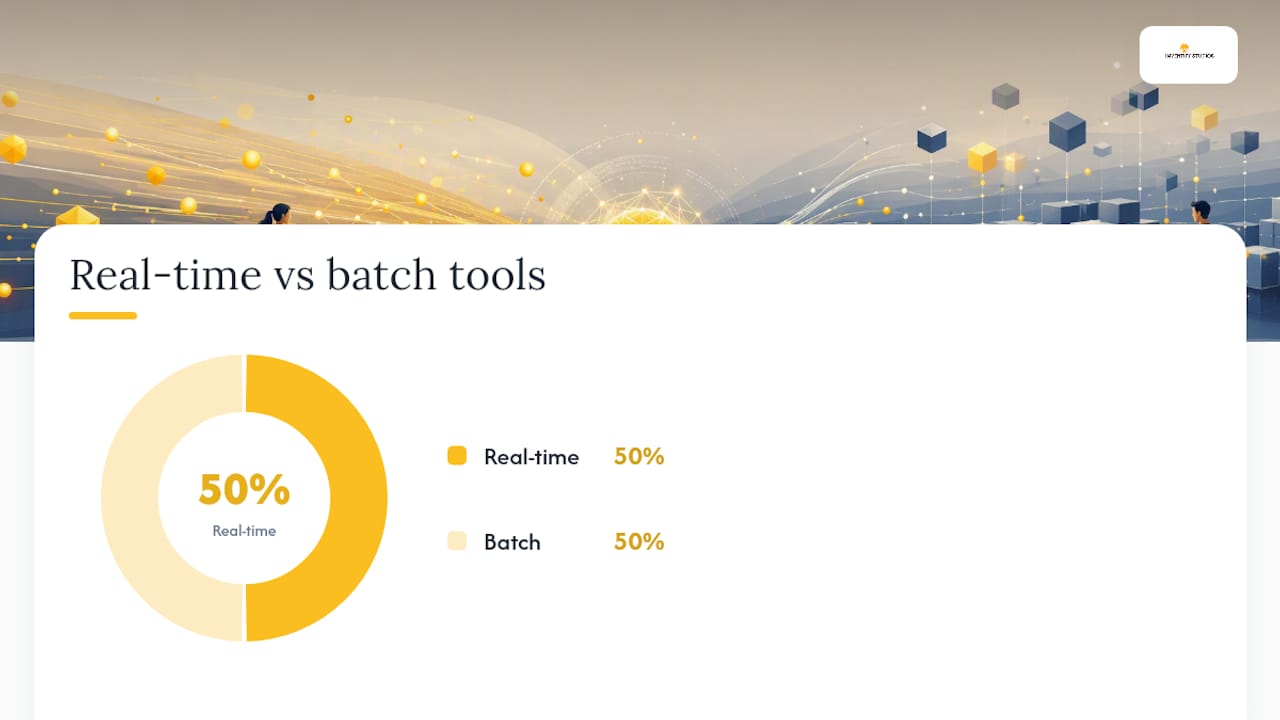
| Tool | Best for | Data types | Real-time vs. batch | Pricing model |
|---|---|---|---|---|
| GA4 | Web/app behavioral data | Behavioral events, conversions | Real-time | Free (enterprise-priced) |
| Mixpanel | Product analytics, cohort/funnel | User-level events | Real-time | Usage-based, free tier available |
| Qualtrics | CX surveys, qualitative research | Survey, NPS, operational data | Batch | Enterprise contract |
| NielsenIQ | Category benchmarking, panels | Transactional panel, household | Batch | Enterprise contract |
Pro Tip: Start with GA4 and one qualitative layer (even a free survey tool) before investing in enterprise platforms. The most common waste in analytics tooling is buying Qualtrics or a CDP before the team has a working event taxonomy and a defined use case. Instrument first, then scale the stack. For guidance on how AI reduces the cost of early-stage insight gathering, the same principle applies: validate the signal before you invest in the infrastructure.
Selection checklist:
- Data ownership: can you export raw event data, or are you locked into the vendor's UI?
- Governance: does the platform support consent-state filtering and data-deletion requests?
- Integration cost: how many engineering hours does the connection to your warehouse require?
- Speed to insight: can a non-engineer answer a behavioral question in under 30 minutes?
- Team skillset: does the tool match the SQL and statistics fluency of your actual team?
For a broader view of how AI marketing tools support segmentation and predictive analytics, the same selection logic applies: match the tool's capability to the team's current skill level, not the team you plan to hire.
What pitfalls and ethical risks should you watch for?
Measurement errors are more common than most teams admit. The most damaging ones:
- Survivorship bias: Analyzing only active users ignores the customers who churned before you could observe them. Your "typical user" profile is systematically skewed toward people who stayed.
- Selection bias in experiments: If users self-select into a test variant, you are measuring the effect of self-selection, not the treatment.
- Overfitting: A propensity model that performs well on training data but fails on new data is worse than no model, because it produces confident wrong predictions.
- Proxy misuse: Cart abandonment rate is a proxy for purchase intent, not a direct measure of it. Optimizing the proxy without validating the underlying behavior produces misleading results.
- False causation: Correlation in behavioral data is abundant. Causation requires a controlled experiment or a credible natural experiment design.
On the ethics side, the same psychological drivers that make consumer behavior analysis powerful (social proof, scarcity, loss aversion) can be deployed manipulatively. Data minimization, explicit consent, and de-identification are both legal requirements in covered U.S. states and sound practice for maintaining customer trust. The CCPA and CPRA set baseline standards; state-level laws in Virginia, Colorado, and Connecticut add further requirements. Confirm current obligations with qualified legal counsel.
Pro Tip: Run a quarterly data audit: review what you are collecting, confirm it is still necessary for a defined use case, and delete records that exceed your stated retention period. Audits also catch instrumentation drift, where event names or schemas change silently and corrupt historical comparisons.
Operational controls that reduce risk: pre-registered experiment hypotheses (prevents p-hacking), holdout groups for major product changes, and a governance committee that reviews new data collection before it goes live.
What 2026 trends are reshaping consumer behavior analysis?
Three research-backed shifts are changing which signals matter most at this time.
Reviews are now the primary purchase driver. The 2026 Frontiers in Communication study found that 46.3% of consumers name reviews and ratings as their top purchase factor. The implication: review sentiment analysis belongs in your core pipeline, not a side project. Track review volume, average rating, and sentiment trend as leading indicators of conversion and retention.

AI agents are entering the purchase funnel. Accenture's 2026 Consumer Pulse, based on a survey of 25,590 consumers across 16 countries, finds consumers delegating shopping tasks to AI agents in category-dependent ways. Agent-driven purchases alter basket size and brand selection dynamics. New signals to track: delegation preference by category, agent-prompted search queries, and brand mentions in AI-generated recommendation outputs. For teams building AI-driven content and recommendation strategies, this shift requires adding prompt-derived signals to existing behavioral pipelines.
Intentional spending is replacing impulse buying. Capgemini's Consumer Trends 2026 report documents a shift toward more selective purchasing under cost-of-living pressure, with fewer impulse buys and more deliberate trade-off decisions. Analysts should prioritize high-CLTV segments and model the trade-off calculus (price sensitivity vs. perceived value) rather than optimizing for volume.
Practical implications for your analytics strategy:
- Add review sentiment as a KPI alongside NPS and CSAT
- Instrument for AI-referral traffic and agent-prompted sessions in GA4
- Shift CLTV models to weight deliberate, repeat buyers more heavily than one-time purchasers
- Test value-framing messages against discount-framing for price-sensitive segments
Environmental and economic conditions also shape category-level demand. Research on biology-environment interactions shows that economic harshness affects desire for conspicuous consumption products differently across categories, a finding that supports building macro-condition variables into demand forecasting models.
What should you build first? A practitioner perspective
Most teams that struggle with consumer behavior analysis are not short on data. They are short on focus. The instinct to instrument everything before defining a single objective produces warehouses full of events and no clear answer to any business question.
The most direct path to value: pick one high-stakes decision your team faces in the next 90 days, identify the two or three behavioral signals that most directly inform it, and build the minimum instrumentation to capture those signals cleanly. Then run one experiment. Not a dashboard. Not a segmentation project. One experiment with a hypothesis, a metric, and a control group.
That first experiment teaches your team more about your customers than six months of passive data collection. It also builds the organizational muscle for acting on behavioral insight, which is harder to develop than the technical infrastructure.
Inventors and product creators face the same challenge: understanding what customers actually want before investing in development. Inventifystudios applies this same behavioral logic to invention validation, combining market analysis tools and AI-driven insights to help creators test demand signals before committing to full development. The principle is identical: define the question, collect the minimum necessary signal, and act on the result.
Sources
- Principles of Marketing — Understanding consumer markets and buying behavior
- Frontiers in Communication — 2026 study on digital purchasing and the influence of reviews and social ads
- NielsenIQ — Consumer behavior research overview
- Wiley International Encyclopedia of Marketing — Consumer behavior analysis entry
- Accenture — Consumer Pulse 2026